Can Egypt Pull Through This Global Turmoil?
Written for Alborsa Newspaper - Euromoney 2008 Edition

Egypt's Economy
The Egyptian economy has been going through an expansionary period which started from 2004 to date. No doubt, the cabinet reshuffle back in July 2004 provided the impetus for the years to follow. It was not just about new faces taking over the reigns at that time, but it was a sea change in terms of proactively seeking reforms across all fronts, be it political, economic, legislative, financial, and even business-related – to name a few. This expansionary mode has recently come under pressure as global turmoil – kick started in the US – started to filter through to the rest of the world and the Egyptian economy. Exponentially higher commodity prices have led to higher prices of essential goods on every Egyptian's food menu. This culminated into a growing inflationary environment fueled by imported inflation on one hand and local measures taken by the Government of Egypt (GoE) on the other hand. With inflation now becoming fact of life, the GoE's goal is to deal with inflation in a way that does not stifle economic growth over the next few years and live up to the challenge of weather the global financial storm. As such, Egyptian and foreign investors will be eyeing every move with caution.
A. Fiscal Policy
The country has been beleaguered with low-growth revenues that are far exceeded by high-growth expenditures, mainly to address social as well as political agendas. The new cabinet that came to office in July 2004 underwent a paradigm shift by trying to grow state revenues as much as possible to outweigh hard-to-cut expenditures that are much needed by the majority of population. This new ideology began to bear fruit as the fiscal deficit, which reached at a point of time above 10% of GDP, eased to single-digit figures.
GDP
Real GDP growth rate has been above 4% since FY2003/04. It ratcheted up from 3.2% in FY2002/03 to as high as an estimated 7.2% in FY2007/08. Private consumption continues to make up the bulk of GDP with a contribution of around 75%, followed by investment (around 20%), government consumption (c. 10%), and net exports (around -5%). GDP growth rate has been fueled by private consumption throughout the past 6 years or so. Nominal GDP is estimated to have reached LE 870 billion in FY2007/08 and is expected to exceed LE 1 trillion in FY2008/09 – the first time ever it passes this threshold.
Figure 1: Composition of 2007/08 GDP
Source: CBE
Revenues
Taxes continue to contribute the most to total revenues, averaging above 60% over the last ten years. Income tax revenues are the main contributor to overall tax revenues, with income taxes coming from the Egyptian General Petroleum Corporation making up the bulk of income tax revenues, followed by the Suez Canal Authority. Taxes aside, Suez Canal is also a major revenue generator with its contribution increasing over the same period as a result of higher number of ships passing through – thanks to growing world trade – and higher canal transit fees. Almost every month, the canal reports all-time-high monthly revenues.
Expenditures
Wages and subsidies contribute the most to total expenditures, totaling around 55% of total expenditures in FY2007/08. In view of the 30% wage increase implemented by the GoE in May 2008, wages are expected to increase in FY2008/08 to around LE 80 billion versus LE 62 billion in the previous fiscal year. Meanwhile, subsidies, grants, and social benefits grew by over 50% to around LE 90 billion in FY2007/08, driven mainly by higher energy and food subsidies. Petroleum makes up the bulk of subsidies (over 70%), thanks to higher crude oil prices and its derivatives. This is followed by food which makes up around 17% of subsidies.
Figure 2: Subsidies breakdown (FY2007/08)
Source: GoE, media sources
Budget Deficit
The budget deficit is estimated at around LE 55-60 billion (6.7% of GDP) in FY2007/08 and is expected to reach LE 70-75 billion (6.9% of GDP) in FY2008/09. As a result of expenditures overruns fueled mainly by higher subsidies, the GoE is more likely to miss its target set a few years ago: cutting the budget deficit by 1% a year.
Figure 3: Overall fiscal balance as a percentage of GDP
Source: CBE
B. Monetary Policy
High inflation rates…
The story line is often easy to tell in hindsight. One can try to make sense after putting all stories together in a mosaic picture. We reckon that the negativity (and the downtrend for that matter) has started with the 5 May economic measures, which helped lead – along with imported inflation – to further inflationary pressures in Egypt's economy. Inflation had reached a 19-year high of 22.2% in July 2008, driven mainly by food inflation which makes around 43% of the consumer price index (CPI) basket. This was just the beginning of higher inflation readings, registering 23.6% in August 2008 and – more recently – 21.5% in September 2008.
Figure 4: Inflation rates – consumer and food
Source: CAPMAS
…leading to high interest rates…
This impelled the Central Bank of Egypt (CBE) to turn hawkish as it began hiking interest rates; it did so four times following the 5 May measures for a total of 200 basis points since then and 275 basis points year-to-date in six consecutive times. Not only does this mean a higher cost of borrowing for Egyptian companies, but it also means a higher discount rate applied by investors to those listed companies' cash flows – implying lower equity valuation across the board. It also means a higher cost of borrowing in the mortgage market which is hoped to drive the real estate sector going forward. As per government officials' announcements in the media, total mortgage loans extended in Egypt has amounted to LE 2.7 bn, which is less than 0.5% of nominal GDP – a very low level compared to developed and neighboring economies. For example, total mortgage loans in the UAE stand at around 10% of GDP!
Figure 5: CASE 30 Index vs. interest rates
Source: CBE, EGX
…raising questions about economic growth
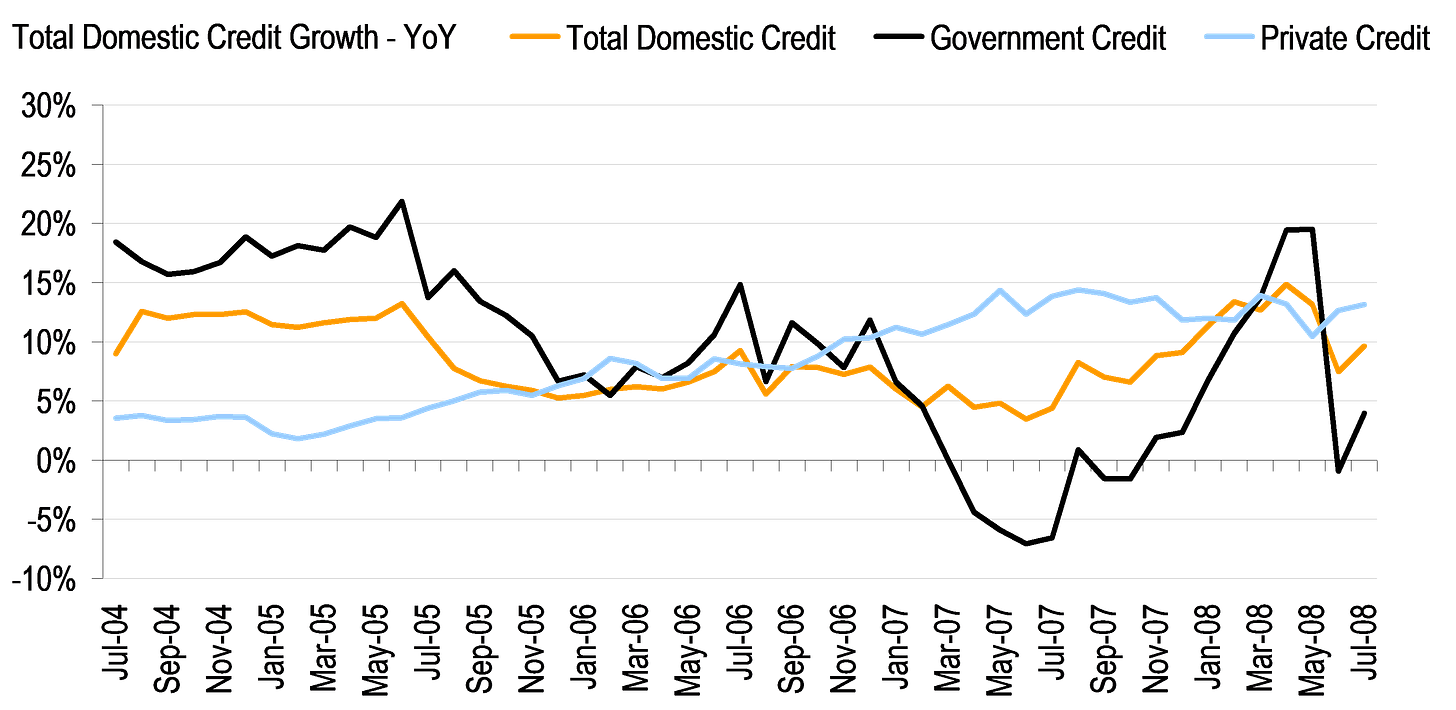
While the Egyptian pound should benefit off those interest rate hikes one after another, investors have eventually become wary of the strength of the economy against such inflationary pressure and how consumers – a major driving force – will be affected. Currently, Egypt has negative real interest rates, which is often good for consumer credit. But this story may be dented as Egyptian's purchasing power wanes, especially when consumer credit YoY growth rates are slowing down a bit recently. Hence, investors – in general – may be worried about three main issues:
A strong Egyptian pound that may weaken in the wake of continued inflationary pressures.
A slowing consumer credit market and an even slower start to the mortgage market.
Eventually, weak corporate earnings that can filter through to employees' pay and – again – purchasing power.
Figure 6: Credit growth by type - YoY
Source: Central Bank of Egypt – CBE
Figure 7: Private sector credit growth - YoY
Source: Central Bank of Egypt – CBE
Figure 8: Egyptian pound performance
Source: Reuters
C. External Position
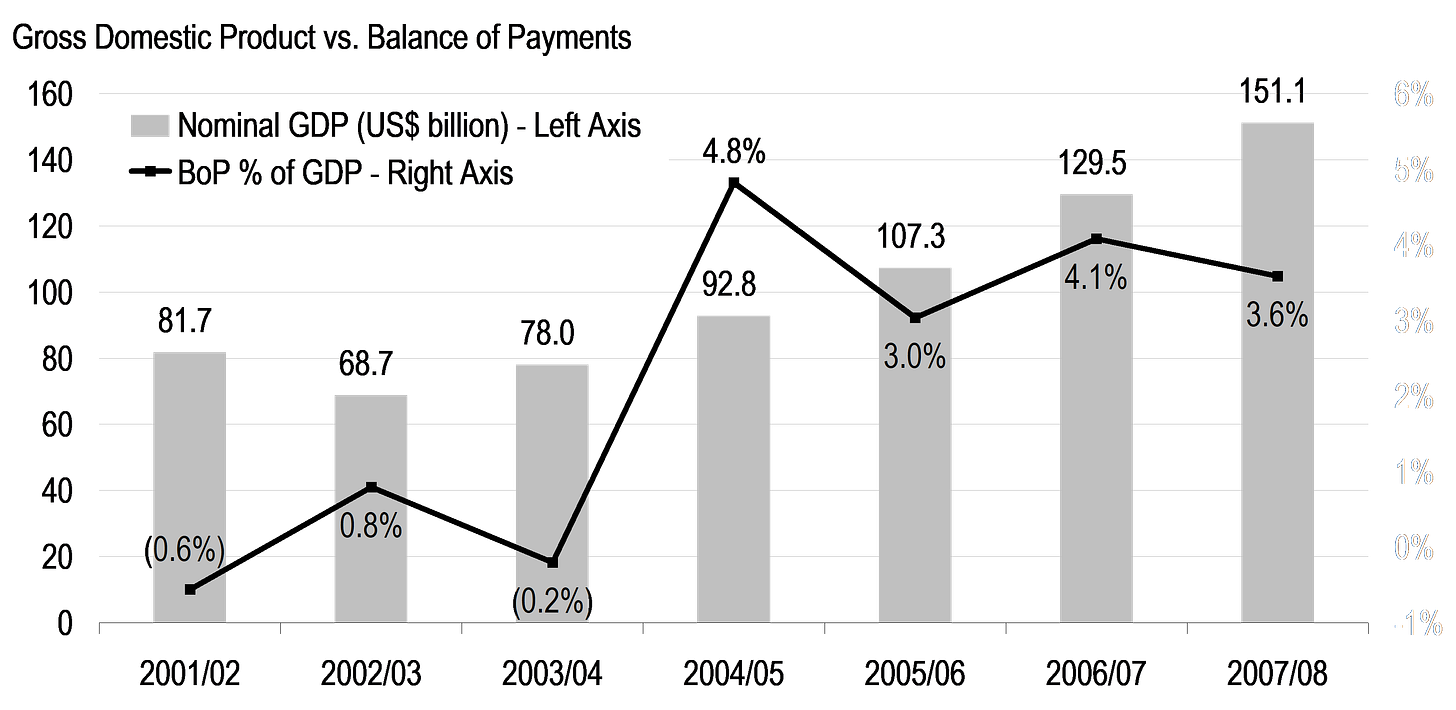
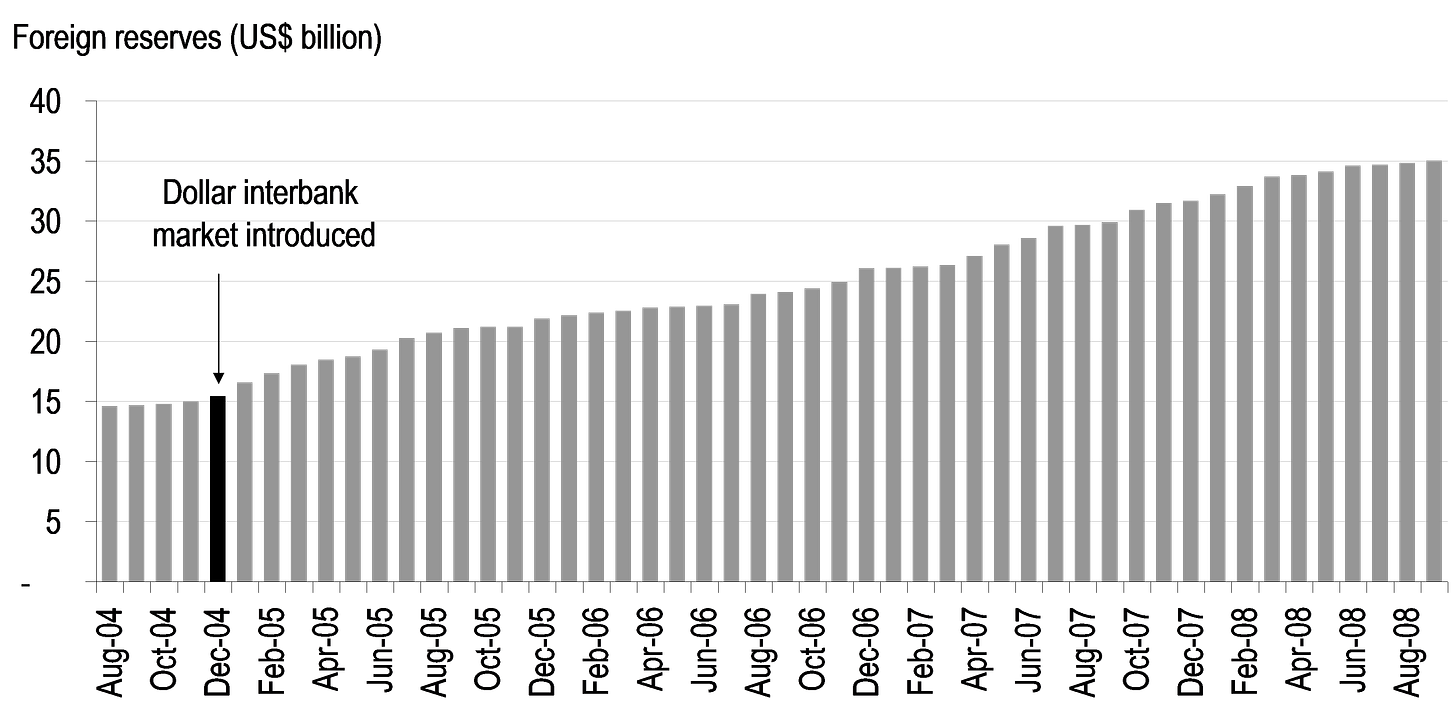
Egypt's external position continued to improve in FY2007/08 with balance of payments recording an overall surplus of US$5.4 billion during the year, up from US$5.3 billion in FY2006/07. Accordingly, international reserves at the CBE increased by a similar amount. Both current account and capital & financial account both recorded surpluses in FY2007/08, amounting to US$0.9 billion and US$7.1 billion, respectively.
Figure 9: GDP vs. BoP
Source: CBE
1. Current Account
In FY2007/08, current account was in surplus for the seventh fiscal year in a row. It turned surplus this year in 3Q ended March on lower trade deficit and higher services surplus while transfers stabilized quarter-on-quarter. However, the current account surplus in FY2007/08 was 61% lower than that a year ago and 59% lower than the average annual surplus over FY2001/02-FY2006/07 period. A lower surplus was a direct result of 44% higher trade deficit versus only 30% higher services surplus, which was further mitigated by 32% higher transfers.
Trade Balance
Trade deficit grew by 44% to US$23.4 bn in FY2007/08 on the back of a 38% (US$14.5 billion) higher imports bill of US$52.8 billion. Both petroleum and non-petroleum imports were higher by 132% (US$5.4 billion) and 26% (US$9 billion). The former which reached US$9.6 billion was mainly driven by higher oil prices, whereas the latter amounted to US$43.2 billion due in part to higher commodities prices, such as wheat. It is worth noting that Egypt is the one of largest wheat importers with around 7 million tons per annum. On the other hand, exports continued to show healthy growth rates, up 33% to US$29.4 billion, driven by both petroleum and non-petroleum products – but petroleum products contributed the most (59%) to export growth over the fiscal year.
Services Balance
Partially balancing off trade deficit, services balance continued to be surplus which increased by 30% to US$15 billion, thanks to 33% (US$6.8 billion) higher receipts of US$27.2 billion versus 37% (US$3.3 billion) higher payments. Tourism and Suez Canal continue to be Egypt's two main foreign-currency earners – contributing 54% of growth in services receipts. Tourism receipts grew by 32% to US$10.8 billion, while Suez Canal revenues grew by 24% to US$5.2 billion, driven partially by around 7% higher transit fees which became effective in April 2008. Payments, on the other hand, were driven by external tourism, up by 51%, as more Egyptians travel abroad.
Figure 10: Current account main drivers
Source: CBE
Transfers
Bringing the current account into surplus was transfers which grew by 32% to US$9.3 billion. Higher transfers were mainly driven by private transfers which grew by 34% to US$8.4 billion as Egyptians living abroad transferred back home more funds, thanks in part to growing GCC economies which provides high-caliber Egyptians with better employment opportunities.
2. Capital & Financial Account
In FY2007/08, capital and financial account was in surplus for the fourth fiscal year in a row and throughout all four quarters of that year. Foreign direct investments (FDIs) have been the main driver behind such a surplus, growing from US$3.9 billion in FY2004/05 to a recent US$13.2 billion in FY2007/08. This compares favorably to an annual average of only US$511 million in the first few years of this decade (FY2000/01-FY2003/04). Interestingly, FDIs have been flowing into oil and gas as well as banks, telecommunications, and real estate.
Figure 11: FDIs
Source: CBE
Figure 12: Net international reserves – NIR
Source: CBE
Figure 13: No. of imports months covered by NIR
Source: CBE
II. Egypt's stock market
No one can claim that they can cure wounds caused by a debilitating stock market or profess that they know it all. After all, even the US market became vulnerable to missteps of its own making. But one can probably say that we could be unknowingly shooting ourselves in the foot. This may at first seem like a broad statement, but we would like to pinpoint some bullish as well as bearish aspects that – we believe – have led to such a huge sell-off in Egyptian equities over the past few months, more notably these past few weeks. In the following sections, we attempt to analyze the recent stock market performance from a fundamental point of view, being company-/sector-related, economic, or simply madness of the crowd!
A. Market Factors
1. Sentiment
World markets: mixed performance turning negative across the board
The last couple of months have been unique for world markets, specifically equities. At one hand, commodities markets have soared to unprecedented levels, spurred by a weak US dollar and a growing global inflation. Market participants have been mostly blaming the US economic slowdown that began to reverberate into other developed markets in Europe and developing markets in Eastern Europe, Latin America, Asia, and Africa. Also, high oil prices – while benefiting GCC and other oil producing countries – led in part to generally higher costs. Commodity prices – whether industrial (e.g. copper, aluminum), precious metals (e.g. gold, silver), or food items (e.g. wheat, corn, sugar) – exacerbated an already inflationary environment. The world has really become so intertwined to the point that it may be exhibiting a "Dominos theory" effect. It's not a matter of politics or economics anymore. It's not even a matter of relative competitive advantages. It's now a matter of liquidity and capital flows between markets of all types seeking maximum return on capital. Globalization has made it easier for investors to move capital from one market to another in different asset classes. Transaction frictions have been largely reduced, and once-local investors have transformed into global ones with a wider scope, looking for a big bang on the buck. Meanwhile, as emerging markets develop in size and sophistication, global investors became more educated about these new markets. This eventually led to higher correlations between almost all world markets – probably for no inherent fundamental reason other than volatility becoming the name of the game.
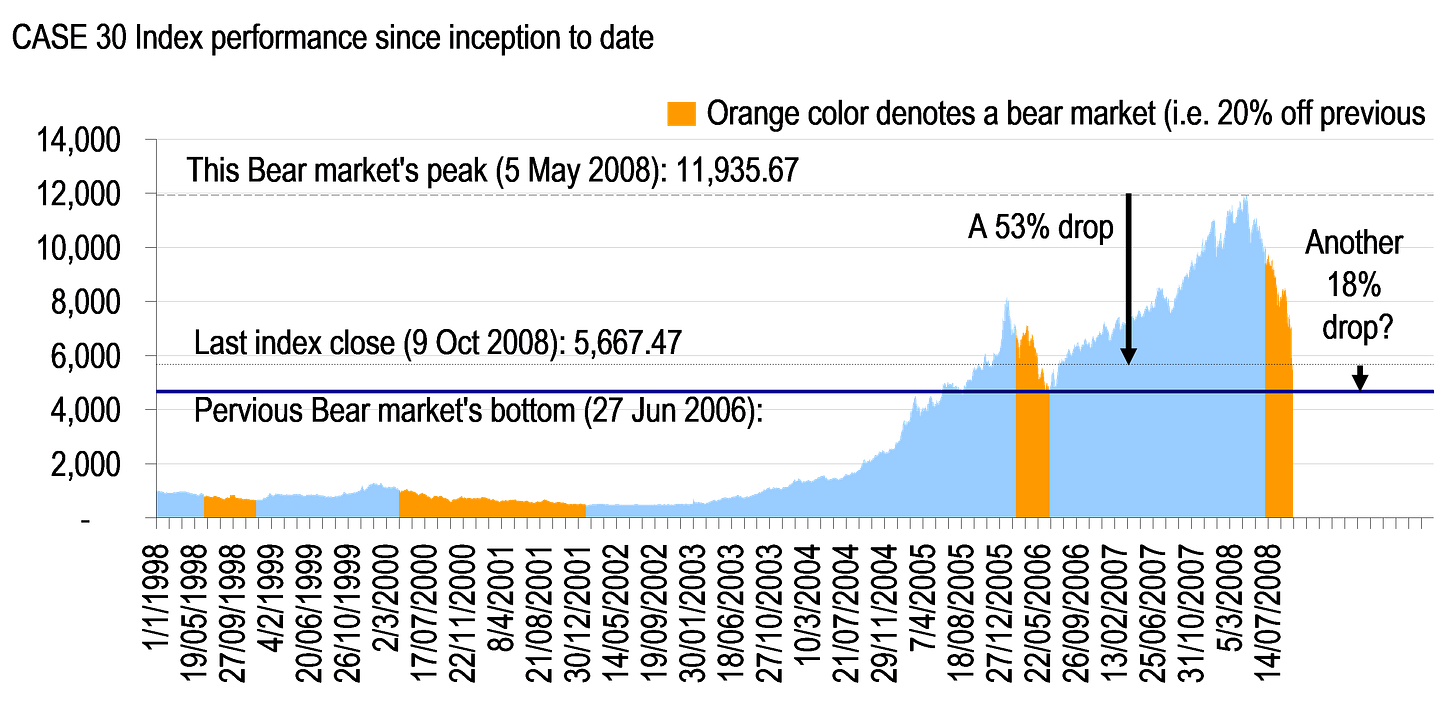
Figure 14: CASE 30 Index four bear markets (1998-2008)
Source: EGX, analysis
Egyptian equities: negative sentiment rules
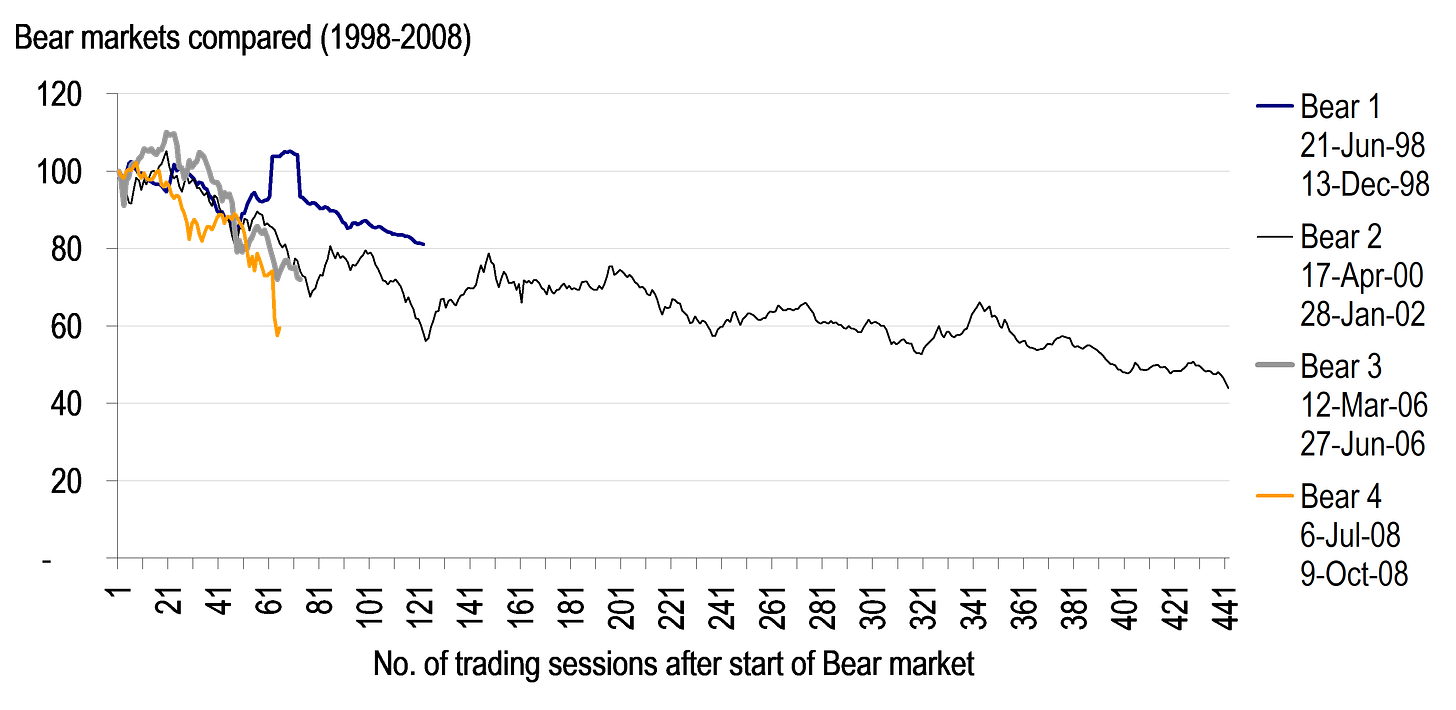
In Egypt, the bearish sentiment was seemingly ignited by the government-led, Parliament-approved 5 May economic measures. Market reaction at the time was slowly adding further selling pressure that culminated into an official bear market beginning in July 2008. (Generally speaking, a 20% drop from a market peak is considered as the "official" start of a bear market.) Indeed, we ran an exercise tracking the CASE 30 Index performance since inception in 1998 to-date (a 10-year period, mostly capturing a full economic and business cycle). It turns out that the CASE 30 Index (a proxy for Egyptian equities) has gone through three bear markets in 1998, 2000/2001, 2006, and – more recently – in 2008.
Bears are awakened in 2006…
Egypt – being one of the relatively new emerging markets making it to global investors' radar screens over the past few years – has been feeling the pain of globalization as evident in its stock market performance in first half of 2006 and - more recently – in 2008. In 2006, the market peaked early February hitting an all-time high at the time of 8,139.96 points, only to see its value cut in half in just three months' time! The situation was even exacerbated for the Egyptian equity market as emerging markets felt the pinch of market volatility in the wake of concerns over growth in Asian markets in the second quarter of 2006. The CASE 30 index bottomed at 43% off its peak before it began to recover to as high as 6,973 points by end of 2006 and 11,936 points by early May 2008. This represents rates of return of 50% and 157%, respectively, which placed Egypt as one of the top performing stock market among emerging, if not global, markets.
…and reawakened in 2008!
In 2008, the Egyptian equity market kicked off a good start earlier in the year with share prices propped up to as high as 13% year-to-date, only to drop by 53% off that peak – a much higher drop than the one witnessed in 2006 (based on closing prices of 9 October 2008). The market outperformance up to 5 May 2008 was driven by sustained earnings growth on the part of Egyptian corporates and an overall wider sentiment-driven appetite for emerging market stocks. We can venture to say that soaring commodity prices, which are mostly produced in emerging markets, have added to this euphoria of investing in emerging markets in general. More recently, commodity prices have begun to cool off from their all-time peaks due in part to an imminent overall slowdown in the global economy, specifically in developed economies which means a slow growth for emerging markets – the providers of most basic raw materials. Add to this the over one-year-old sub-prime mortgage debacle in the US market, which resonated throughout all global credit markets and transformed into a global credit crisis affecting large financial institutions no one could possibly fathom would be this vulnerable.
Figure 15: Bear markets compared (1998-2008)
Source: EGX, analysis
2008 Bear is the sharpest
Comparing all four bear markets since their start (i.e. since they crossed the 20% lower than previous peak), we find out that the current bear market in 2008 has been by far the sharpest ever. Within a very short period of time (only 61 trading sessions), it was down around 40% since its start. On the other hand, it took as much as twice that period (i.e. over 120 trading sessions) for the second bear market (2000-2002) to be down this 40%, yet it was by far the cruelest and the longest: it ended down over 56% since its start.
2. Trading Structure
Retail investors stepping in the market in 2005…
As a group with different characteristics, retail investors have been leading the market as a percentage of daily trading value for quite some time. Their contribution was once as high as 80% early 2006 down slightly to around the 40-60% range. However, the flip side of the coin was perceived market volatility, given the characteristics of retail investors. Historically speaking, the role of retail investors started to flourish on the Egyptian Exchange (EGX) late 2005, when the landmark Telecom Egypt IPO was launched with almost LE 5 billion in size. Almost every other friend or relative you knew subscribed to the IPO marking their first investment ever in the stock market. This shows how many retail investors took a dip in the market without any experience whatsoever, hence leaving room for more than ever irrational behaviors.
…supported by several factors at the time,
Aggravating the situation were several factors, such as increasing the number of stocks trading with higher daily price limits, launching margin trading, and allowing same-day trading. All that meant was – again – volatility. Today, retail investors are more involved in the stock market than two years ago. They have embraced and invested in small-cap stocks, where they created a league of their own. Lately, retail investors have been anchored by the performance of large-cap stocks. Once the CASE 30 index breaks an important support level, retail investors turn negative on their own holdings, even if they are long off-index bets. This gets the whole market in a vicious cycle that starts with large caps and ends with small caps, dragging the market even lower!
…yet foreign investors – once long Egyptian equities – began selling in 2008…
Ever since mid 2006, when the EGX began disclosing trading data by type of investor, non-Arab foreign investors have been net buyers of Egyptian equities (LE 5.8 billion in 2H06 and LE 18.2 billion in 2007). They only started to turn negative on the market and showed up as net sellers this year (specifically in February) with a net selling value of LE 1 billion year-to-date, more or less excluding odd transactions. Obviously, no one had expected non-Arab foreigners to continue as net buyers forever! There must be a time when portfolio rebalancing is due. Unfortunately, this year was the time as global markets continued to suffer as well as regional ones. Even if Egypt had no issues to endure, simple math suggests global investors would cut their Egypt exposure as their other non-Egypt holdings drop in value. Needless to say, the global financial crisis was the last straw that made the whole situation delicate.
B. Market Impact
1. Historical performance
Gainers and … losers
It is quite hard to tell which sector has really been the safest of all 12 defined by the EGX. Only four of the twelve sectors have not actually dropped below their initial values since the beginning of 2007, namely Industrial Goods & Services (up 95%), Construction & Materials (up 33%), Food & Beverages (up 9%), and Chemicals (up 2%). On the negative side, both Telecom and Personal & Household Products sectors were the worst sectors, losing 52% and 39% of their values in less than two years. Banks, on the other hand, were only down by 14%, while Financial Services (excluding Banks) down by 20%. Taking a closer look, all twelve sectors were down, with the Food & Beverages sector coming out as the best performer, down only 1% versus CASE 30 Index's down 46%! Travel & Leisure, Real Estate, and Telecom were all down in excess of 60%.
Figure 16: CASE 30 Index and sector performance since inception and YTD
Source: EGX, analysis
Figure 17: Twelve sectors vs. CASE 30 Index (2007-2008 YTD)
Source: EGX, analysis
2. Outlook
All agree it's too early to size up
How does this global crisis translate in Egyptian terms? One will probably find both analysts and economists agreeing to the presumption that the Egyptian economy will be negatively affected by a US and European slowdown to a certain extent. It is fairly early to gauge the size of this impact on the Egyptian economy, but at least we can point out which sectors and areas will most likely be affected. Those sectors that come to mind are tourism, Suez Canal, foreign direct investments (FDIs), external trade, and to a lesser extent banking.
Tourism
As foreign tourists cut down on their spending in view of their local slow economies and higher unemployment rates, Egypt and other touristic destinations are likely to suffer from slowing growth of tourist arrivals.
Suez Canal
As global economies slow, so will global trade, which may translate into fewer shipments passing through the Suez Canal. Amplifying this negative effect is recent pirating of ships passing through the south of the Red Sea, which made global traders think of the old route around the continent of Africa.
FDIs
Furthermore, at time of uncertainty, capital becomes dear to investors and FDIs tend to shy away. This can mean lower FDIs coming to the region, including Egypt. We do not expect FDIs to dry up completely, but there is a high probability that it will wane a bit. Still, the oil and gas sector should continue to attract most of the FDIs followed by the real estate sector.
External Trade
Industries relying mostly on exports will have to reconsider the risks inherent in its business approach. Companies with a narrow focus on the US or European markets will be more affected down the road over the medium term.
Banks
All of the above will sooner or later be reflected on banks' balance sheets. As such, Egyptian banks could be affected if economic growth falters, tourism slows down, and investments fall short of expectations. We believe Egyptian banks' exposure to failing global banks is rather limited due to the former's investments in Egypt's own Treasuries. However, the big question surrounding non-Egyptian private banks is how much they are exposed to their foreign parent banks. So far, none of those major global banks already invested in Egypt have been named in the financial crisis as a major threat – which is soothing for investors.
We are in the midst of a very uncertain environment, where global investors are looking for reasonable explanations from governments, central banks, and corporates as well. As such, we believe there needs to be further disclosure and transparency from all those parties. Investors need to know reality, whether good or bad. At the end of the day, uncertainty is the enemy of capital and investments. Indeed, we must restore confidence in the Egyptian economy by proactively cutting red tape, easing further the way of doing business, and – more importantly – speak out reality even if it bites.


